Visualising results
This tutorial will show you briefly how to visualise some basic results
Visualising the results of the tournament
As shown in Creating and running a simple tournament, let us create a tournament, but this time we will include a player that acts randomly:
>>> import axelrod as axl
>>> players = [axl.Cooperator(), axl.Defector(),
...            axl.TitForTat(), axl.Grudger()]
>>> players.append(axl.Random())
>>> tournament = axl.Tournament(players)
>>> results = tournament.play()
We can view these results (which helps visualise the stochastic effects):
>>> plot = axl.Plot(results)
>>> p = plot.boxplot()
>>> p.show()

Visualising the distributions of wins
We can view the distributions of wins for each strategy:
>>> p = plot.winplot()
>>> p.show()

Visualising the payoff matrix
We can also easily view the payoff matrix described in Access tournament results, this becomes particularly useful when viewing the outputs of tournaments with a large number of strategies:
>>> p = plot.payoff()
>>> p.show()

Saving all plots
The axelrod.Plot class has a method: save_all_plots that will
save all the above plots to file.
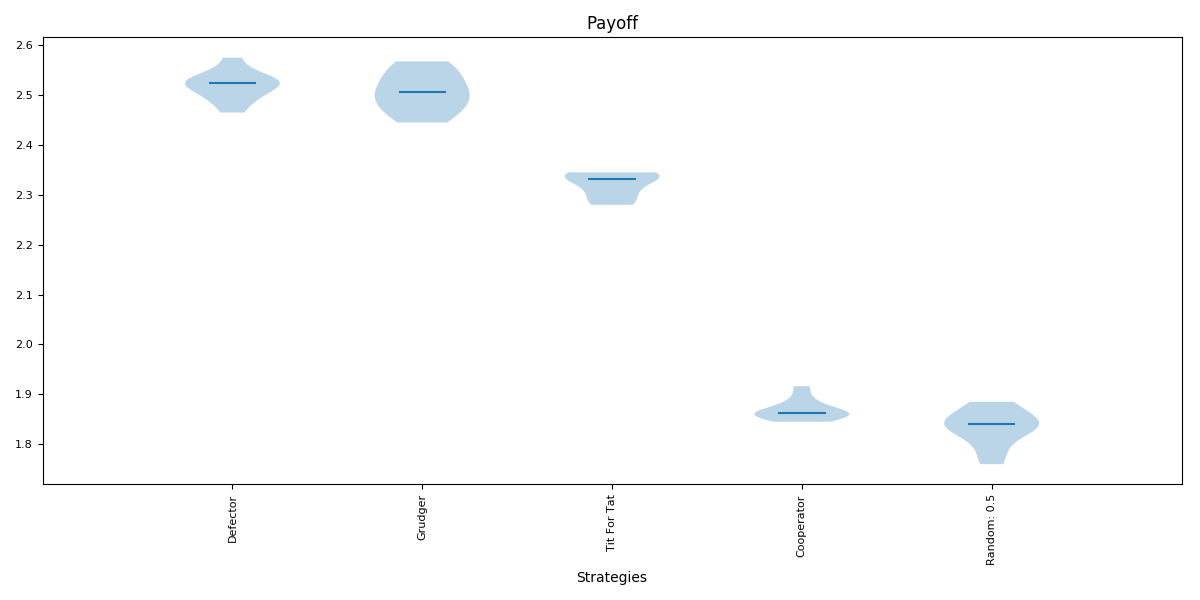
Passing various objects to plot
The library give access to underlying matplotlib axes objects of each plot, thus the user can easily modify various aspects of a plot:
>>> import matplotlib.pyplot as plt
>>> _, ax = plt.subplots()
>>> title = ax.set_title('Payoff')
>>> xlabel = ax.set_xlabel('Strategies')
>>> p = plot.boxplot(ax=ax)
>>> p.show()